# Matplotlib
# 基本概念:Figure 与 Axes
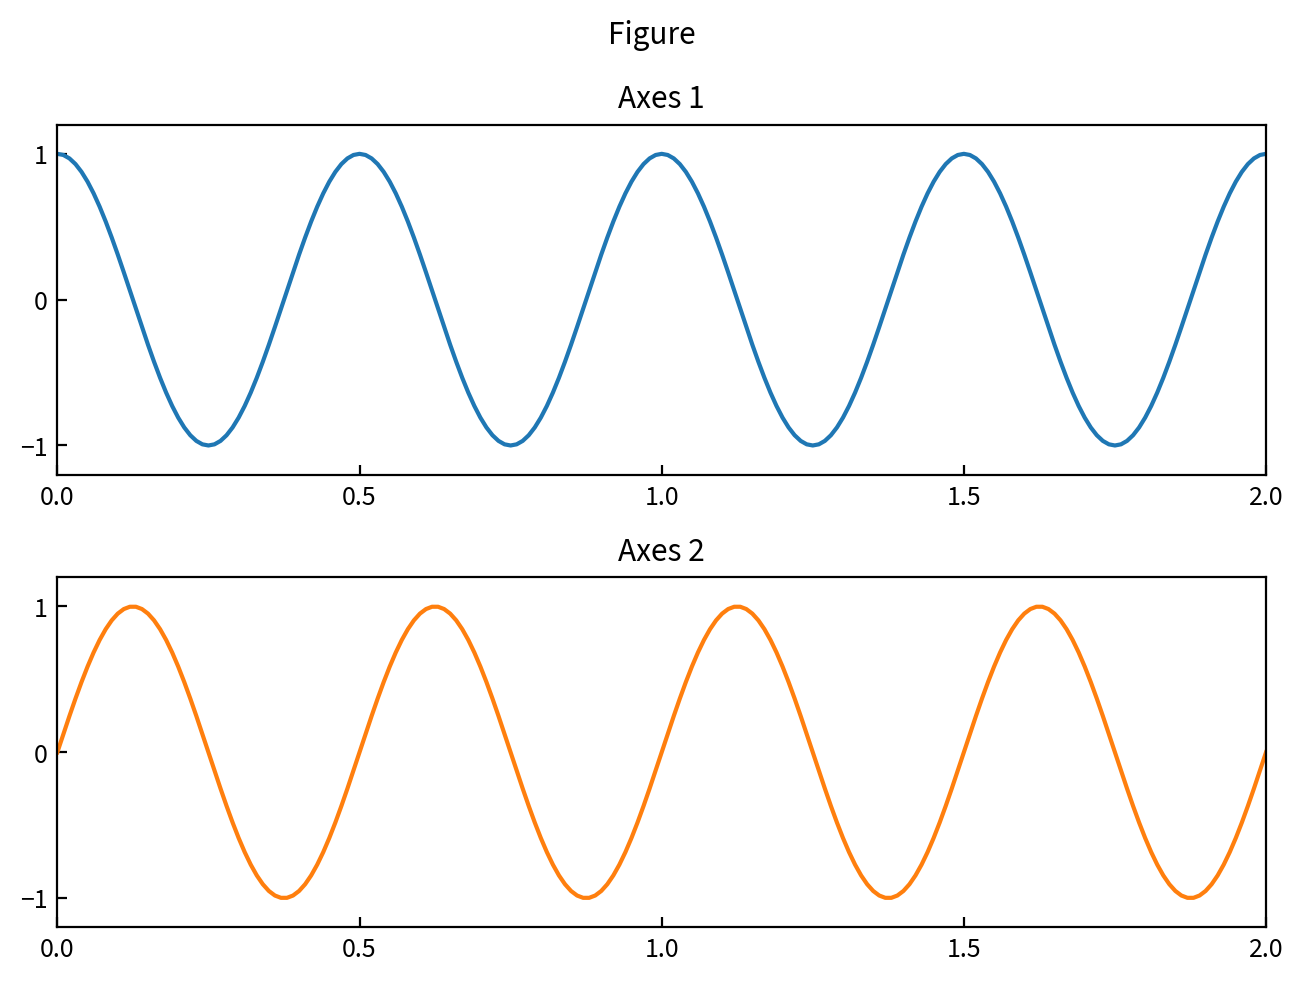
Figure with 2 AxesFigure代表了整张图片 (figure.savefig),像一个容器(可以设置figsize,dpi等)Axes则包括了真正要画的内容,比如坐标轴、折线、文本
Matplotlib 提供了两套 API:
pyplotAPI,模仿 MATLAB 的语法风格,适合临时画图(一通plt.xxx搞定),- 面向对象风格的 API,显式地操作上述
Figure,Axes对象,便于进行细节的控制和管理,特别是代码需要重复使用的时候。
前者 plt.xxx 相当于始终在「当前的」Figure 或 Axes 对象上操作,与 ax.xxx 或者 ax.set_xxx 相对应。
import matplotlib.pyplot as plt

## 默认为一个 Axes/Subplot
fig, ax = plt.subplots()  ## (nrows=1, ncols=1, ..., **fig_kw)
ax.plot(x, y)
fig.savefig("out.png")

## ==================

## 多个 Axes,两行一列
fig, (ax1, ax2) = plt.subplots(2, 1)  ## 使用 `constrained_layout=True` 避免 Axes 重叠

ax1.plot(x1, y1)
ax1.set_title("Axes 1")

ax2.plot(x2, y2)
ax2.set_title("Axes 2")

fig.suptitle("Figure")
fig.savefig("out.png")
# 配置 (Configuration)
配置文件
import matplotlib
print(matplotlib.matplotlib_fname())
## 'C:\Users\<username>\Miniconda3\lib\site-packages\matplotlib\mpl-data\matplotlibrc'

## User-level config file:
## 'C:\Users\<username>\.matplotlib\matplotlibrc'
可以用来设置默认字体
WARNING
新安装的字体可能会找不到,删掉 $HOME\.matplotlib\fontlist-*.json 缓存文件即可
在程序中也可以进行配置,比如
plt.rc("text", usetex=True)
plt.rc("font", family="serif")
plt.rc("font", **{"sans-serif": "Consolas"})

plt.rcParams.update({
    "text.usetex": True,
    "text.latex.preamble": "\\usepackage{...}",
    "font.family": "serif",
})
一些默认值
figure.figsize : 6.4, 4.8  ## figure size in inches
font.size      : 10        ## default 'medium' size (all relative values: xx-small, x-small,
                           ## small, medium, large, x-large, xx-large, larger, or smaller)
# 刻度 (Ticks)
可以选择合适的 tick locator (opens new window) 决定刻度的位置,再使用 tick formatter (opens new window) 来决定对应的文本
# 主、副刻度 (Major and minor ticks)
from matplotlib.ticker import MultipleLocator

ax.xaxis.set_major_locator(MultipleLocator(20))
ax.xaxis.set_minor_locator(MultipleLocator(5))
## 使用下面一行来显示副刻度的标签 (minor tick labels)
# ax.xaxis.set_minor_formatter(FormatStrFormatter('%d'))
如果只想画给定的若干刻度,可以使用
from matplotlib.ticker import FixedFormatter, FixedLocator

ax.yaxis.set_minor_locator(FixedLocator([5.69, 7.76]))
ax.yaxis.set_minor_formatter(FixedFormatter(["5.69", "7.76"]))
## major ticks 同理
# 刻度样式
使用 ax.tick_params (opens new window) 来控制刻度的方向,颜色,大小等等(ax 为 matplotlib.axes.Axes 对象),比如
## 将刻度画在图内部
ax.tick_params(direction="in")
## 也可以只应用到某些部分,例如只缩小 y 轴、副刻度的字体大小
ax.tick_params(axis="y", which="minor", labelsize=6)
# 让 x, y 轴等刻度
# plt.axis("equal")
## 一般来说上面的用法就够了,但是如果同时对 xlim, ylim 有要求的话,下方的用法更准确
ax = plt.gca()
ax.set_aspect("equal", adjustable="box")
# Colormap
# Colormap 与 Mappable
Colormap用来把 [0, 1] 数值转化成 RGBA 颜色值Mappable则可以对Colormap进行放缩(借助Normalize)- 然后使用
mappable.to_rgba(X)(opens new window) 进行转换
- 然后使用
from matplotlib.cm import ScalarMappable
from matplotlib.colors import Normalize

## The default colormap assumes range [0, 1]. `ScalarMappable` allows custom range.
mappable = ScalarMappable(Normalize(-1, 1), "bwr")
## Don't know why but `set_array` may be needed
## https://stackoverflow.com/a/49036899/8682688
# mappable.set_array(np.array([...]))

certain_patch.set_color(mappable.to_rgba(value))

plt.colorbar(mappable)
# 使 Colorbar 刻度为整数
from matplotlib.ticker import MaxNLocator

bar = fig.colorbar()
bar.locator = MaxNLocator(integer=True)
bar.update_ticks()

## 如果是坐标轴的话
# plt.gca().yaxis.set_major_locator(MaxNLocator(integer=True))
# 使 Colorbar 和作图区域等高
im = plt.imshow()  ## ...
plt.colorbar(im, fraction=0.046, pad=0.4)
不知道原理但是很神奇(更多讨论 (opens new window))
# Subplots
Matplotlib demo (opens new window)
import matplotlib.pyplot as plt

fig, axes = plt.subplots(2, 2, sharex=True, sharey=True)  ## figsize=(6.4, 4.8)
## add a big axis, hide frame
fig.add_subplot(111, frameon=False)
## hide tick and tick label of the big axis
plt.tick_params(labelcolor="none", which="both", top=False, bottom=False, left=False, right=False)

## 保存为 pgf 格式时 labelcolor 不生效,需要额外添加下面两行
# plt.xticks([0], [" "])
# plt.yticks([0], [" "], rotation="vertical", fontsize="xx-large")

plt.xlabel("common X")
plt.ylabel("common Y")
# Default Color Cycle
prop_cycle = plt.rcParams["axes.prop_cycle"]
colors = prop_cycle.by_key()["color"]
Click to copy
# 动画
import matplotlib.animation as animation

fig, ax = plt.plt.subplots()

def ani_func(i):
    line.set_xdata([i, i])
    line.set(alpha=1)

n_frames = 100
fps = 25

line = ax.axvline(x=0, ymin=-1, ymax=11)
line_ani = animation.FuncAnimation(fig, ani_func, frames=n_frames)

writer = animation.FFMpegWriter(fps=fps)
line_ani.save("animation.mp4", writer=writer)
# PGF 格式与 LaTeX
Matplotlib 可以导出 pgf 格式的图片,其本质是一系列 tex 命令。使用 pgf 格式可以让图片中的文本使用当前 LaTeX 文档所用的字体,从而保持一致。
plt.savefig("example.pgf")
在此之前可以使用 fig.set_size_inches(w=4, h=3) 来调整图像画布大小
\usepackage{pgf}

\begin{document}

\begin{figure}
    \centering
    \input{example.pgf}
\end{figure}

\end{document}
可以使用 \resizebox{0.6\textwidth}{!}{\input{example.pgf}} 来整体缩放图像